1
/
of
1
Blue Vase Books
Learning to See Data: How to Interpret the Visual Language of Charts (The Data Literacy Series) - 997
Learning to See Data: How to Interpret the Visual Language of Charts (The Data Literacy Series) - 997
Regular price
$23.47
Regular price
Sale price
$23.47
Unit price
/
per
In stock
Couldn't load pickup availability
This book is a stand-alone component of the 'Data Literacy Level 1' course: https://dataliteracy.com/courses/data-literacy-level-1
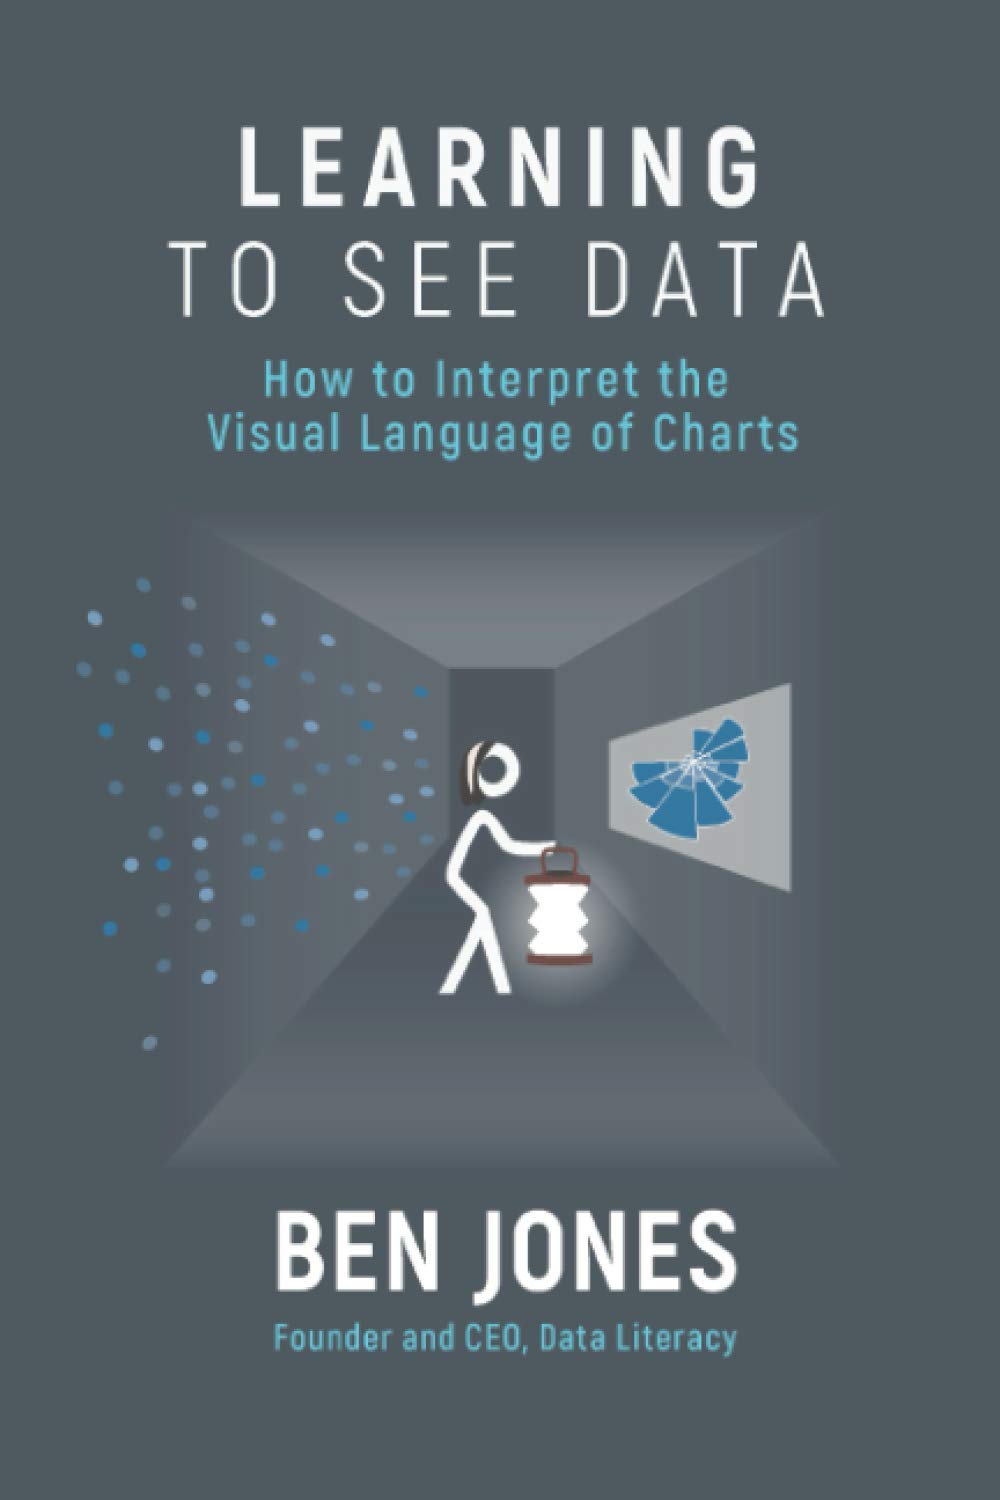
For most of us, it's rare to go a full day without coming across data in the form of a chart, map or dashboard. Graphical displays of data are all around us, from performance indicators at work to election trackers on the news to traffic maps on the road. But few of us have received training or instruction in how to actually read and interpret them. How many times have we been misled simply because we aren't aware of the pitfalls to avoid when interpreting data visualizations.
Learning to See Data will teach you the different ways that data can be encoded in graphical form, and it will give you a deeper understanding of the way our human visual system interprets these encodings. You will also learn about the most common chart types, and the situations in which they are most appropriate. From basic bar charts to overused pie charts to helpful maps and many more, a wide array of chart types are covered in detail, and conventions, pitfalls, strengths and weaknesses of each of them are revealed.
This book will help you develop fluency in the interpretation of charts, an ability that we all need to hone and perfect if we are to make meaningful contributions in the professional, public and personal arenas of life. The principles covered in it also serve as a critical background for anyone looking to create charts that others will be able to understand.
Praise for Learning to See Data
"This book is clear and evocative, thorough and thoughtful, and remarkably readable: a marvelous launchpad into the world of data." –Tamara Munzner, Professor, University of British Columbia Computer Science
"Everyone of us needs good data literacy skills to survive in the modern world. Without them, it's hard to succeed at work, or survive the onslaught of information (and misinformation) across all our media. Ben's book provides the necessary building blocks for a strong foundation. From that foundation, Ben's approach will inspire you to own the process of developing your skills further." –Andy Cotgreave, Technical Evangelism Director, Tableau
"Just like reading a book, learning how to consume charts is fundamental to learning how to produce. LEARNING TO SEE DATA is a generous companion for those seeking a head start in how to read data visualization. It is dedicated to appreciating how charts work. Today, this lesson is necessary for all as we are flooded with graphic information every day. It is also an essential pause for anyone who makes charts in today's overwhelming ecosystem of data and tools. Acknowledge the primacy of how to *inform* before being swept away with the intricacies of how to create information.
Today's data novice faces a steep ascent. Author Ben Jones is the expert guide to help you climb. He teaches charts via public and university classes. Jones also onboarded thousands to data visualization via his leadership of the Tableau Public community. -RJ Andrews, author of Info We Trust
ASIN: 1733263446
VSKU: BVV.1733263446.VG
Condition: Very Good
Author/Artist:Jones, Ben
Binding: Paperback
ASIN: 1733263446
VSKU: BVV.1733263446.VG
Condition: Very Good
Author/Artist:Jones, Ben
Binding: Paperback
SKU:BVV.1733263446.VG
Shipping & Local Pick Up
Shipping & Local Pick Up
Shipping: Most orders are shipped within 24 hours. Please allow 4-14 days after the item has shipped for delivery. Faster shipping is available for purchase at checkout.
Local Pick Up: Orders will be available for pick up within 24 hours. Pick up at the front desk Thursday-Sunday 10am-6pm .After hours pick ups are available Monday-Wednesday 7am-3pm at the Shipping & Receiving entrance.


